Property News by Rich Harvey of Propertybuyer– A Hotspotting Partner
Back when the coronavirus pandemic began to take hold in Australia and we collectively stared down the barrel of unprecedented uncertainty, some very bold predictions were made about property prices.
Almost every economic and real estate commentator feared that markets would collapse in a way we’ve never seen before, with estimated losses ranging between 20 and 40 per cent. It was going to be a catastrophe.
When it wasn’t a catastrophe and median price movements defied all expectations by either not changing at all, slipping only very modestly or increasingly a little, the excuses came thick and fast.
It’s the really low listing volumes! If no one is selling, then median price data is meaningless! That’s why prices haven’t collapsed! And low listings are a disaster!
It’s true – listing volumes around Australia have been significantly down on past trends. It seems that unless they absolutely have to sell right now, the vast majority of would-be vendors are sitting on their hands until the world become a little more certain.
And it’s also true that sustained demand from buyers in markets like Sydney is ensuring continued resilience in prices.
We’re told by experts that the seriously low number of listings is a bad sign. It shows flat confidence, it hints at prices that should be lower than they are, and it shows that there’s more uncertainty to come. Or does it?
There’s much more to it when you dig down into the raw data. It actually paints a picture of growing confidence among sellers, higher than thought buyer activity and a rebound in sentiment.
Ordinarily, this time of year is frantic for property. Spring is a time of action when buyers are buoyed by the warmer weather and busy Saturdays inspecting their possible next home or future investment, and sellers are filled with confidence.
But in September, total listings at a national level fell by 1.2 per cent. Year-on-year, listings across the country are now down 7.4 per cent compared to September in 2019.
Those experts must be right… right? Listing volumes haven’t collapsed everywhere, though. Just look at this data from SQM Research.
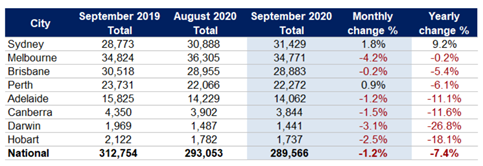
The biggest fall in listings in September was in Melbourne, which was still in the grips of the toughest COVID-19 lockdowns in the world. Victoria’s economy is on pause, people have been virtually confined to their homes, the streets are empty and no one is buying… and yet there are still more listings than anywhere else in the country, with just a 0.2 per cent fall year-on-year.
How about that?
In Sydney, the economic powerhouse of Australia and the country’s most populous capital city, listing volumes are up 9.2 per cent compared to this time last year, and up 1.8 per cent on August.
There are some shocking numbers in that table, with double digit reductions in property listings in Adelaide, Canberra, Darwin and Hobart. But those markets are driven by several more volatile factors, like seasonal demand trends, mining, the public service and less resilient economies.
Cast your mind back to September last year. An almost two-year period of price corrections was only just beginning to reverse, with median prices in major cities beginning to tick up again at that time. And yet, 12 months on, in the midst of a global crisis with significant economic, social and health consequences, there are more properties for sale in Sydney and only slightly less in Melbourne.
On top of all of that, SQM Research says the fall in listings in September is likely due in part to increased buyer activity. Stock is being absorbed by buyers, who are out in larger numbers. That’s mirrored by modest lifts in asking prices and exceptionally strong auction clearance rates.
CoreLogic also released listings volume data in September, focusing on new listings – that is, the number of homes newly advertised that month. It found they’re down 22 per cent year-on-year, and 25 per cent below the five-year average.
Its data for total listings indicates a 14 per cent national decline compared to September 2019. So, it’s higher than the SQM modelling.
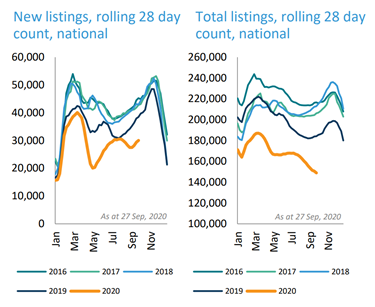
As you can see, total listings are indeed down on previous years, but that decline looks to be plateauing. And the number of new listings is on the rise at a national level.
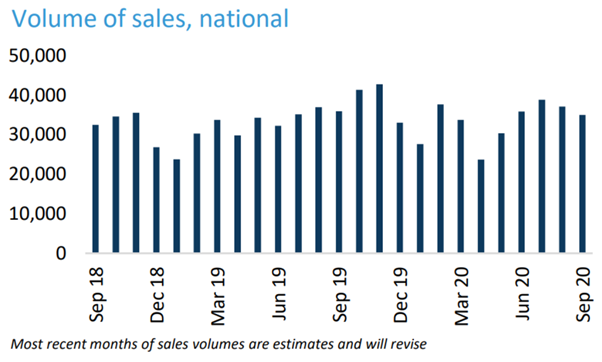
In releasing this data, CoreLogic added that buyer demand looks to be recovering. Activity is on the rise and there’s been a recent upward trend in values across some cities as a result. Sales volumes in the September quarter was up 2.8 per cent on this time last year, according to its initial estimates.
You know what’s likely to encourage greater confidence among would-be sellers? Buyer activity. The more people out and about, the more normal conditions will feel. A return to normal will a greater number of us the positive sentiment to buy and sell again.
And on that measure, buyer activity is tracking well. Just look at this CoreLogic data on monthly property sales.
So… listings are low, but not as low as feared and even on the increase in some locations – especially Sydney… and buyer activity is rebounding, driving price increases.
That sounds like the recipe for a period of price growth if you ask me.


