Quote Of The Week
“Every Australian capital city has seen a lift in the number of new real estate listings over recent weeks, with some of the largest listing increases recorded in those capitals navigating lockdown.”
Tim Lawless, CoreLogic
House Prices Drive Rise In Wealth
 Australians have become even wealthier in the past year, with new figures revealing the growth in property values has helped drive household wealth up by 5.8%.
The latest ABS figures on household wealth for the June Quarter 2021 shows that household wealth has now hit a record $13,433 billion, with wealth per capita up to $522,032.
Residential property contributed 4.5 percentage points to the quarterly growth in wealth, with superannuation adding 1.1 percentage points and shares 0.3 percentage points.
With Australians unable to travel, savings were also high with $341.8 billion now sitting in Australian banks, although household savings weakened in June on the back of further spending and fewer lockdown days.
ABS head of finance and wealth Katherine Keenan says growth in owner-occupier loan balances is the strongest it has been for five years and that the value of loans to owner occupiers hit new highs in the first six months of 2021.
Residential Rental Listings Drop
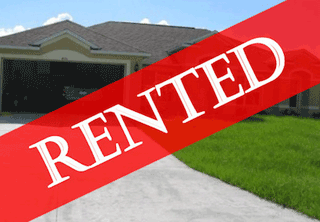 Renters are finding it even harder to secure new premises, with the number of properties available for rent at a near all-time low in August. The latest REA Group’s PropTrack Rental Listings Report reveals that new rental listings dropped by 3.9% in August, the lowest levels since December 2019 before the pandemic hit.
The fall was most substantial in regional Australia with listings down 4.7% in August while in capital cities listings dropped 1.3%. The report found regional NSW, WA and Tasmania experienced the biggest drops in listings.
REA Group director of economic research Cameron Kusher says the high number of owner occupiers buying property is contributing to the lack of rental properties.
New listings in August dropped by 30% in Canberra, 17% in Melbourne, 10% in Hobart, 3.7% in Brisbane, 2.2% in Perth, and 1.1% in Adelaide, while listings increased 6.7% in Sydney and 5.4% in Adelaide.
Vacancy rates are still high in inner-city suburbs in Sydney and Melbourne which have a large proportion of units.
Units Join Price Growth Trend
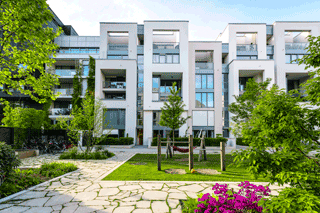 Units are proving popular with buyers, with new data revealing record high demand in many suburbs. CoreLogic figures show demand for units in suburbs with desirable lifestyles are on the rise.
More than half (560) of the 994 unit markets analysed by CoreLogic are experiencing record high prices, with average growth of 16% or $108,000 since March last year. Two thirds of those 560 growth markets are in capital cities.
CoreLogic Australia head of research Eliza Owen says while some apartment markets in the inner cities continue to struggle, she expects to see further value increases in other unit markets, particularly those in desirable lifestyle locations.
Owens says the strong growth in house prices in the past year appears to be slowing slightly with the unit market now experiencing uplift. But there are 434 unit markets which have values still below their pre-pandemic levels with the top ten biggest drops all occurring within Greater Melbourne.
Listings Finally Start To Rise
 The number of properties listed for sale is finally starting to lift, as Australia moves into the so-called Spring selling season. Every capital city has recorded an increase in the number of new real estate listings in recent weeks.
While the lift in listings is good news for buyers, CoreLogic’s Tim Lawless says listings are still below five-year averages in every capital except Adelaide, Perth and Darwin.
The largest lift in new listings is in Melbourne, where the rolling four-week count since the first week of September increased by 48.5%. Lawless says the increase follows the easing of restrictions on property inspections in that city.
Nationally during the same period new listings are up 9.8%, although that is still 3.9% below the five-year average for this time of year.
Sydney’s new listings remain 3.9% below the five-year average for this time of the year, while Hobart and Brisbane listings remain 9.6% and 3.8% below the five-year averages.
Prices Excel In School Zones
 House prices have scored top marks in popular school catchments throughout Australia. The latest Domain School Zones Report shows that buyers continue to pay a premium to live in a catchment which allows their children to attend popular schools.
Domain senior research analyst Nicola Powell says the prices some families are prepared to pay to live in a catchment are “eye-watering”.
“There’s a variety of different price points but let’s be honest, it does not matter what price-point you’re purchasing at, you place a priority on education,” Powell says.
On average, house prices in primary school zones increased 37% across the capital cities in the past 12 months. The top increases for the top primary school zones in each city were Sydney 45%, Brisbane 42%, Melbourne 39%, Hobart 35%, Darwin 34% Canberra 34%, Perth 34% and Adelaide 33%.
The top increase for the top high school zones in each city were: Sydney 45%, Melbourne 33%, Brisbane 31%, Adelaide 22%, Canberra 23%, Perth 43%, Hobart 32% and Darwin 32%.


